My Cart
Your Cart 0

    Your cart is empty.

  • Total (Amount) ₹0.00
Previous year question hub

Data Interpretation - General Aptitude (GA) Previous Year Questions

Practice Data Interpretation - General Aptitude (GA) previous year questions organised from real papers, with year-wise coverage and clear topic navigation.

11Papers
8Years
16Questions
1Topics

Data Interpretation question pattern

Every graph below is calculated only from this selection.

Questions by year

Year-wise coverage for Data Interpretation. Each bar uses a separate theme-derived color.

Difficulty distribution

How the classified questions are distributed by difficulty.

Medium 14 87.5%
Easy 2 12.5%

Question type distribution

MCQ, numerical, multiple-select and other formats found in these papers.

MCQ 10 62.5%
Numerical Answer Type (NAT) 6 37.5%

Subject weightage

Top subjects by unique question coverage.

General Aptitude (GA)
16 Qs

Most asked topics

Top topics across the included previous year papers.

Data Interpretation
16 Qs

Subtopic coverage

Top subtopics inside this exact selection.

Elementary Statistics
16 Qs

Paper coverage

Question coverage for the most populated papers. Every active PYP paper remains listed below.

Electronics & Communication Engineering (EC) 2025
1 Qs
Electronics & Communication Engineering (EC) 2024
1 Qs
Electronics & Communication Engineering (EC) 2021
1 Qs
Electronics & Communication Engineering (EC) 2020
1 Qs
Electronics & Communication Engineering (EC) 2019
1 Qs
Electronics & Communication Engineering (EC) 2016 [Session 3]
2 Qs
Electronics & Communication Engineering (EC) 2015 [Session 2]
4 Qs
Electronics & Communication Engineering (EC) 2015 [Session 1]
2 Qs
Electronics & Communication Engineering (EC) 2015 [Session 3]
1 Qs
Electronics & Communication Engineering (EC) 2014 [Session 1]
1 Qs
Electronics & Communication Engineering (EC) 2014 [Session 4]
1 Qs

Browse by subtopics

Open a focused page built from the same verified paper data.

Included previous year papers

Newest papers appear first. Sort by year, question coverage or name.

PaperYear / sessionQuestions in this viewOpen
Electronics & Communication Engineering (EC) 202520251View paper
Electronics & Communication Engineering (EC) 202420241View paper
Electronics & Communication Engineering (EC) 202120211View paper
Electronics & Communication Engineering (EC) 202020201View paper
Electronics & Communication Engineering (EC) 201920191View paper
Electronics & Communication Engineering (EC) 2016 [Session 3]20162View paper
Electronics & Communication Engineering (EC) 2015 [Session 1]20152View paper
Electronics & Communication Engineering (EC) 2015 [Session 2]20154View paper
Electronics & Communication Engineering (EC) 2015 [Session 3]20151View paper
Electronics & Communication Engineering (EC) 2014 [Session 1]20141View paper
Electronics & Communication Engineering (EC) 2014 [Session 4]20141View paper

Sample previous year questions

A varied preview from the papers represented in this selection, with every available option.

1
2014 · General Aptitude (GA) · Data Interpretation · Elementary Statistics
Electronics & Communication Engineering (EC) 2014 [Session 1]

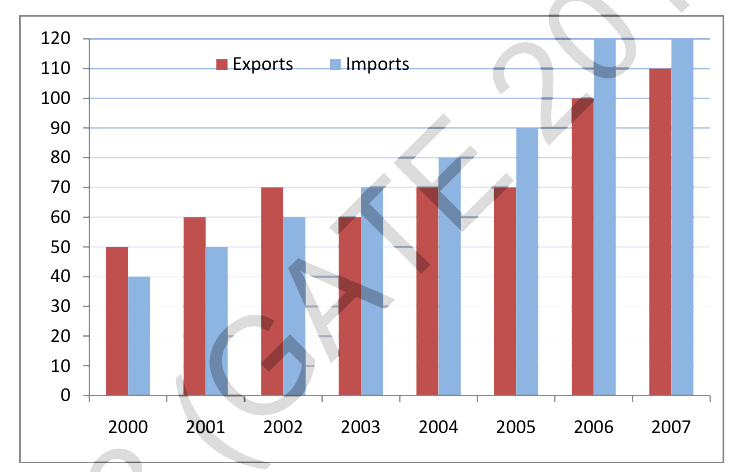
The exports and imports (in crores of Rs.) of a country from 2000 to 2007 are given in the following bar chart. If the trade deficit is defined as excess of imports over exports, in which year is the trade deficit 1/5th of the exports?

Source question diagram

Open complete paper
2
2014 · General Aptitude (GA) · Data Interpretation · Elementary Statistics
Electronics & Communication Engineering (EC) 2014 [Session 4]
In the figure, ln (\(\rho_i\)) is plotted as a function of 1/T, where \(\rho_i\) is the intrinsic resistivity of silicon, T is the temperature, and the plot is almost linear. The slope of the line can be used to estimate
Open complete paper
3
2015 · General Aptitude (GA) · Data Interpretation · Elementary Statistics
Electronics & Communication Engineering (EC) 2015 [Session 1]
Consider a straight, infinitely long, current carrying conductor lying on the z-axis. Which one of the following plots (in linear scale) qualitatively represents the dependence of \(H_{\phi}\) on r, where \(H_{\phi}\) is the magnitude of the azimuthal component of magnetic field outside the conductor and r is the radial distance from the conductor?

Question diagram

Open complete paper
4
2015 · General Aptitude (GA) · Data Interpretation · Elementary Statistics
Electronics & Communication Engineering (EC) 2015 [Session 2]
An electric bus has onboard instruments that report the total electricity consumed since the start of the trip as well as the total distance covered. During a single day of operation, the bus travels on stretches M, N, O, and P, in that order. The cumulative distances travelled and the corresponding electricity consumption are shown in the Table below.
StretchCumulative distance (km)Electricity used (kWh)
M2012
N4525
O7545
P10057

The stretch where the electricity consumption per km is minimum is

Question diagram

Open complete paper
5
2015 · General Aptitude (GA) · Data Interpretation · Elementary Statistics
Electronics & Communication Engineering (EC) 2015 [Session 3]
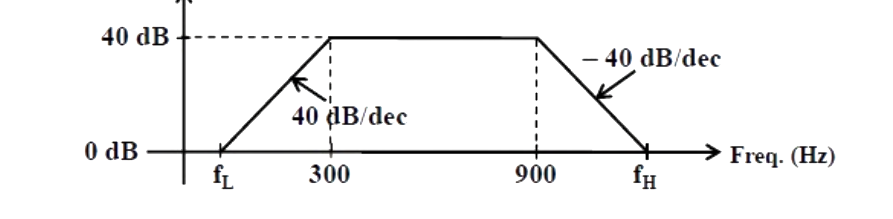
Consider the Bode plot shown in the figure. Assume that all the poles and zeros are real-valued.

The value of \( f_H - f_L \) (in Hz) is ______________.

Question diagram

Open complete paper
6
2016 · General Aptitude (GA) · Data Interpretation · Elementary Statistics
Electronics & Communication Engineering (EC) 2016 [Session 3]
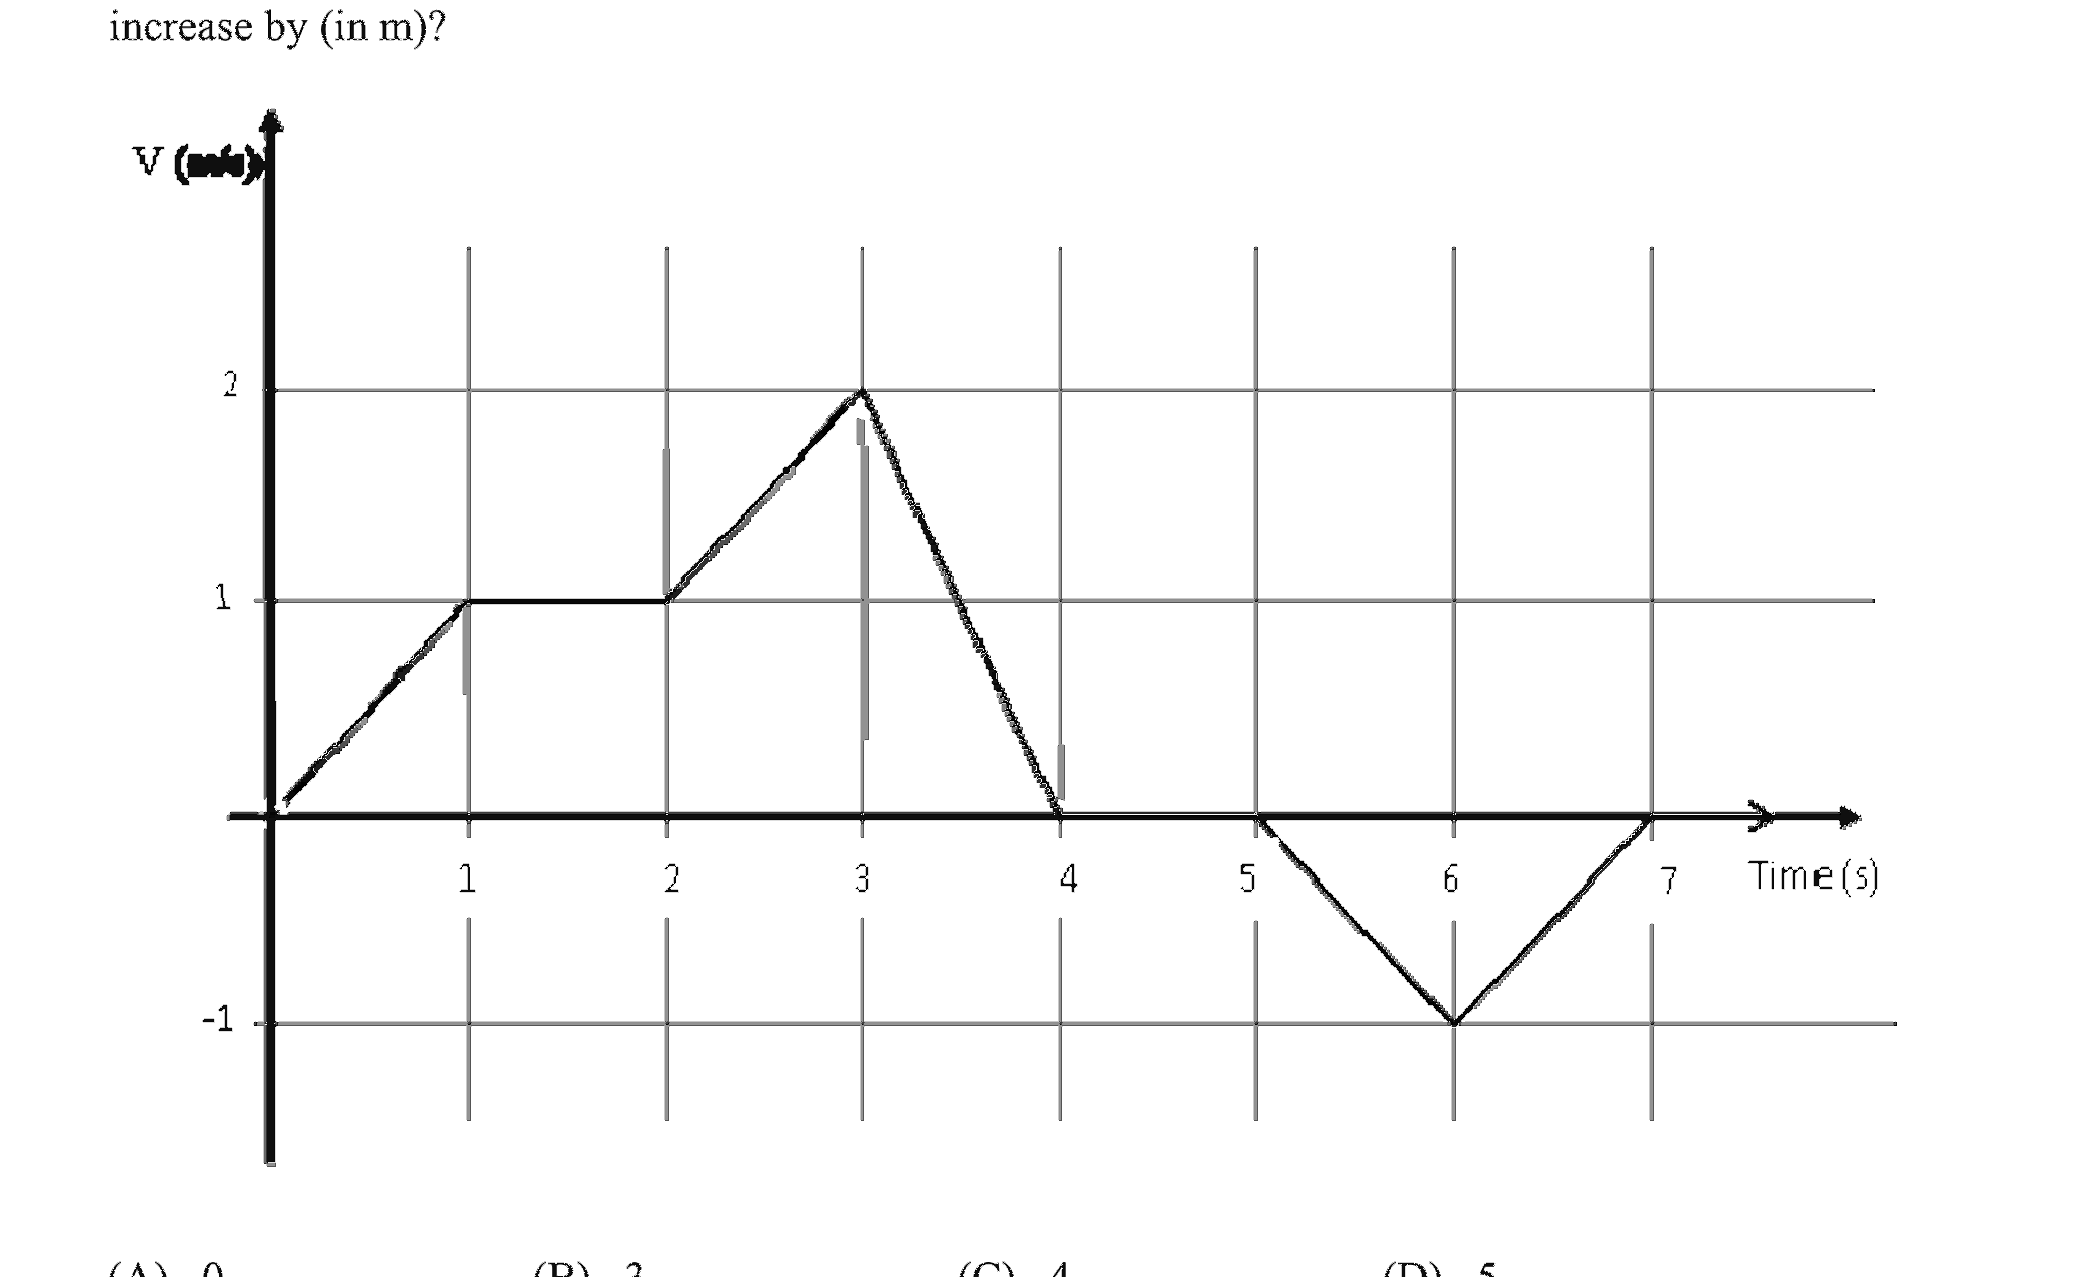
The velocity V of a vehicle along a straight line is measured in m/s and plotted as shown with respect to time in seconds. At the end of the 7 seconds, how much will the odometer reading increase by (in m)?
Open complete paper