My Cart
Your Cart 0

    Your cart is empty.

  • Total (Amount) ₹0.00
Previous year question hub

Elementary Statistics - General Aptitude - General Aptitude (GA) Previous Year Questions

Practice Elementary Statistics - General Aptitude - General Aptitude (GA) previous year questions organised from real papers, with year-wise coverage and clear topic navigation.

2Papers
2Years
4Questions
1Topics

Elementary Statistics question pattern

Every graph below is calculated only from this selection.

Questions by year

Year-wise coverage for Elementary Statistics. Each bar uses a separate theme-derived color.

Difficulty distribution

How the classified questions are distributed by difficulty.

Easy 2 50%
Medium 2 50%

Question type distribution

MCQ, numerical, multiple-select and other formats found in these papers.

MCQ 3 75%
Numerical Answer Type (NAT) 1 25%

Subject weightage

Top subjects by unique question coverage.

General Aptitude (GA)
4 Qs

Most asked topics

Top topics across the included previous year papers.

General Aptitude
4 Qs

Subtopic coverage

Top subtopics inside this exact selection.

Elementary Statistics
4 Qs

Paper coverage

Question coverage for the most populated papers. Every active PYP paper remains listed below.

Ecology and Evolution (EY) 2022
1 Qs
Ecology and Evolution (EY) 2015
3 Qs

Included previous year papers

Newest papers appear first. Sort by year, question coverage or name.

PaperYear / sessionQuestions in this viewOpen
Ecology and Evolution (EY) 202220221View paper
Ecology and Evolution (EY) 201520153View paper

All Elementary Statistics previous year questions

Practice every matching question in batches of 20, with every available option.

1
2015 · General Aptitude (GA) · General Aptitude · Elementary Statistics
Ecology and Evolution (EY) 2015

A researcher used a t-test on two samples of data and obtained the following statistics: sample t-statistic = 5.2, critical t-statistic = 2.3 (for the appropriate degrees of freedom and alpha level of 0.05). Based on this information, the researcher should conclude that

Open complete paper
2
2015 · General Aptitude (GA) · General Aptitude · Elementary Statistics
Ecology and Evolution (EY) 2015
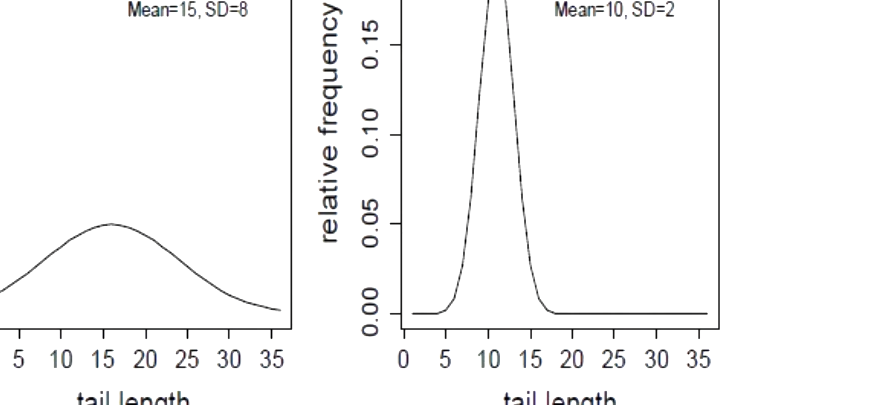
A researcher measures tail length of 1000 individuals in a bird species. In one population, mean tail length (±SD) was 15 (± 8) while it was 10 (± 2) in a second population, as depicted in the figure below. These values remain consistent across many generations. From these data, he can infer that

Question diagram

Open complete paper
3
2015 · General Aptitude (GA) · General Aptitude · Elementary Statistics
Ecology and Evolution (EY) 2015
Tree densities are measured in 5 plots in a study area. An index (Variance in tree density/Mean tree density) estimates whether trees are randomly distributed, clumped or spaced uniformly apart. Tree densities in these 5 sampled plots were 13, 14, 15, 16, and 17. The value of the above index for this data set is __________
Open complete paper
4
2022 · General Aptitude (GA) · General Aptitude · Elementary Statistics
Ecology and Evolution (EY) 2022
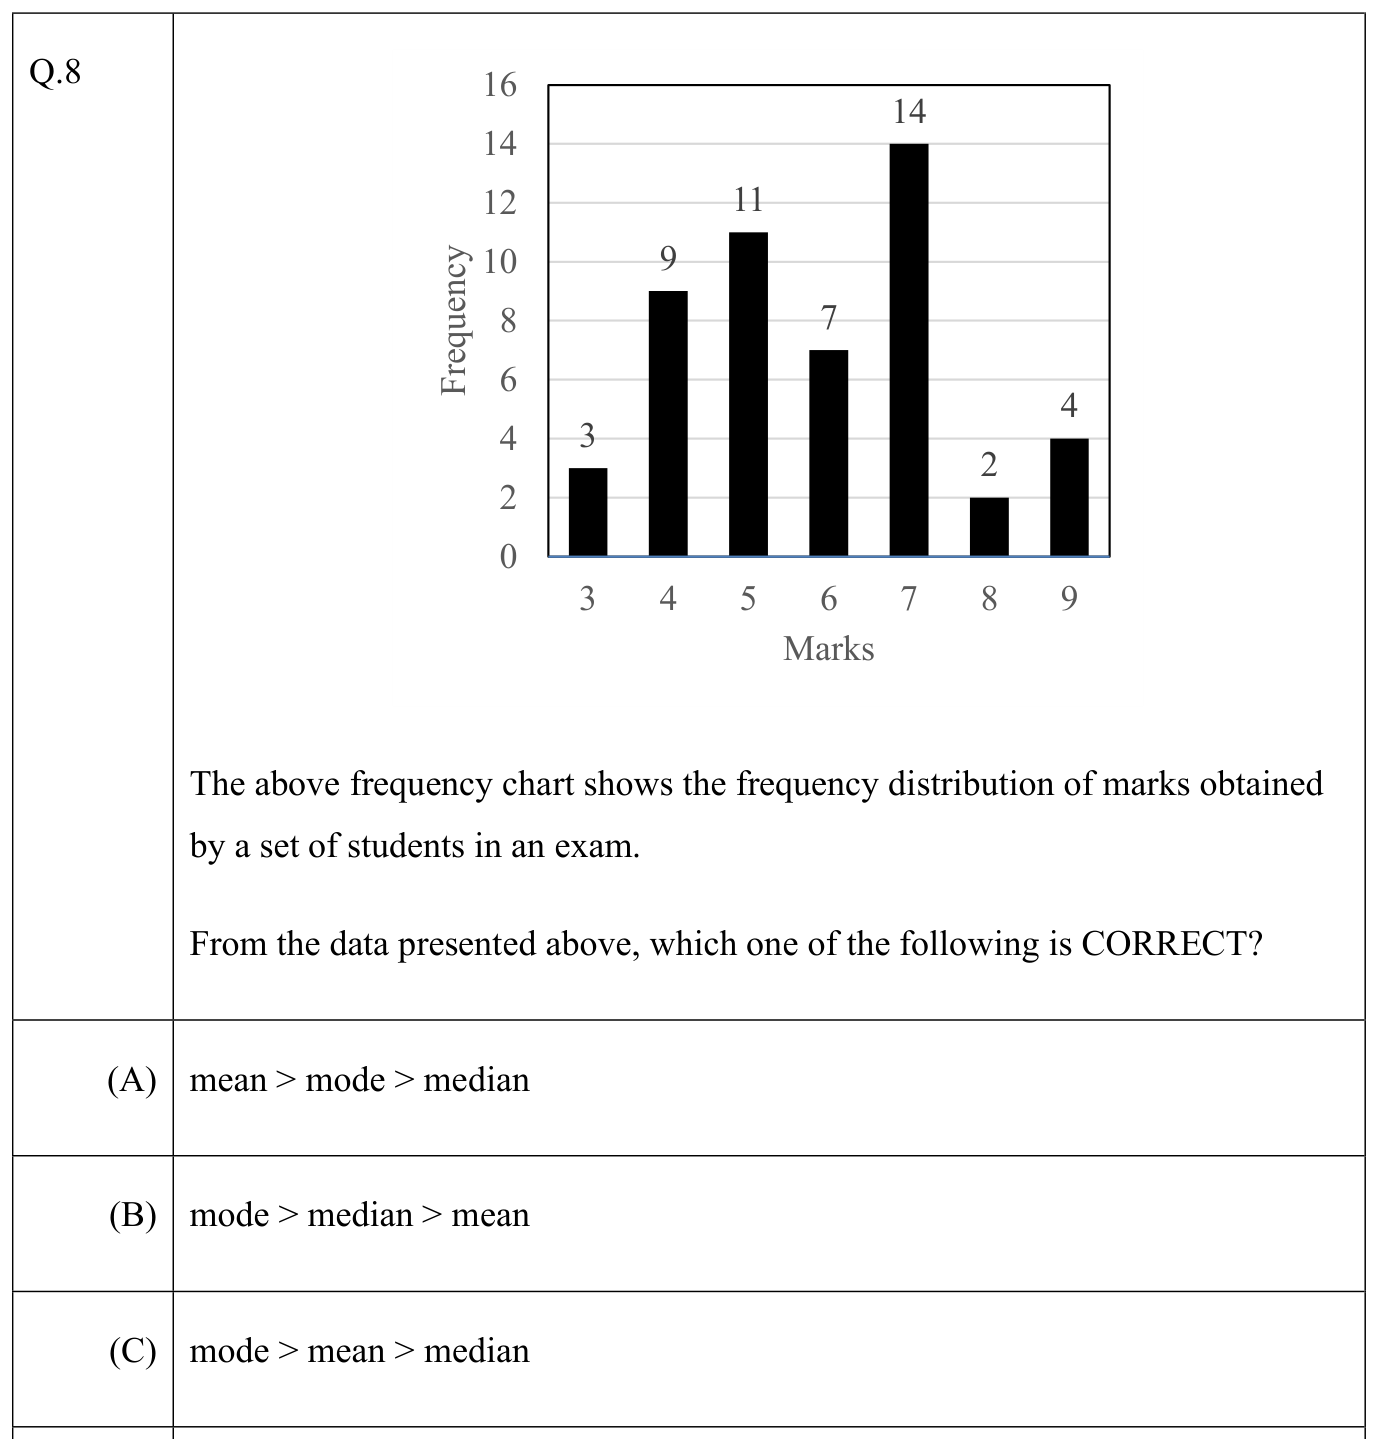
The above frequency chart shows the frequency distribution of marks obtained by a set of students in an exam.

From the data presented above, which one of the following is CORRECT?

Question source image

Open complete paper