My Cart
Your Cart 0

    Your cart is empty.

  • Total (Amount) ₹0.00
Previous year question hub

Data Interpretation - General Aptitude - General Aptitude (GA) Previous Year Questions

Practice Data Interpretation - General Aptitude - General Aptitude (GA) previous year questions organised from real papers, with year-wise coverage and clear topic navigation.

4Papers
4Years
5Questions
1Topics

Data Interpretation question pattern

Every graph below is calculated only from this selection.

Questions by year

Year-wise coverage for Data Interpretation. Each bar uses a separate theme-derived color.

Difficulty distribution

How the classified questions are distributed by difficulty.

Easy 3 60%
Medium 2 40%

Question type distribution

MCQ, numerical, multiple-select and other formats found in these papers.

MCQ 5 100%

Subject weightage

Top subjects by unique question coverage.

General Aptitude (GA)
5 Qs

Most asked topics

Top topics across the included previous year papers.

General Aptitude
5 Qs

Subtopic coverage

Top subtopics inside this exact selection.

Data Interpretation
5 Qs

Paper coverage

Question coverage for the most populated papers. Every active PYP paper remains listed below.

Chemistry (CY) 2025
1 Qs
Chemistry (CY) 2024
1 Qs
Chemistry (CY) 2017
1 Qs
Chemistry (CY) 2016
2 Qs

Included previous year papers

Newest papers appear first. Sort by year, question coverage or name.

PaperYear / sessionQuestions in this viewOpen
Chemistry (CY) 202520251View paper
Chemistry (CY) 202420241View paper
Chemistry (CY) 201720171View paper
Chemistry (CY) 201620162View paper

All Data Interpretation previous year questions

Practice every matching question in batches of 20, with every available option.

1
2016 · General Aptitude (GA) · General Aptitude · Data Interpretation
Chemistry (CY) 2016
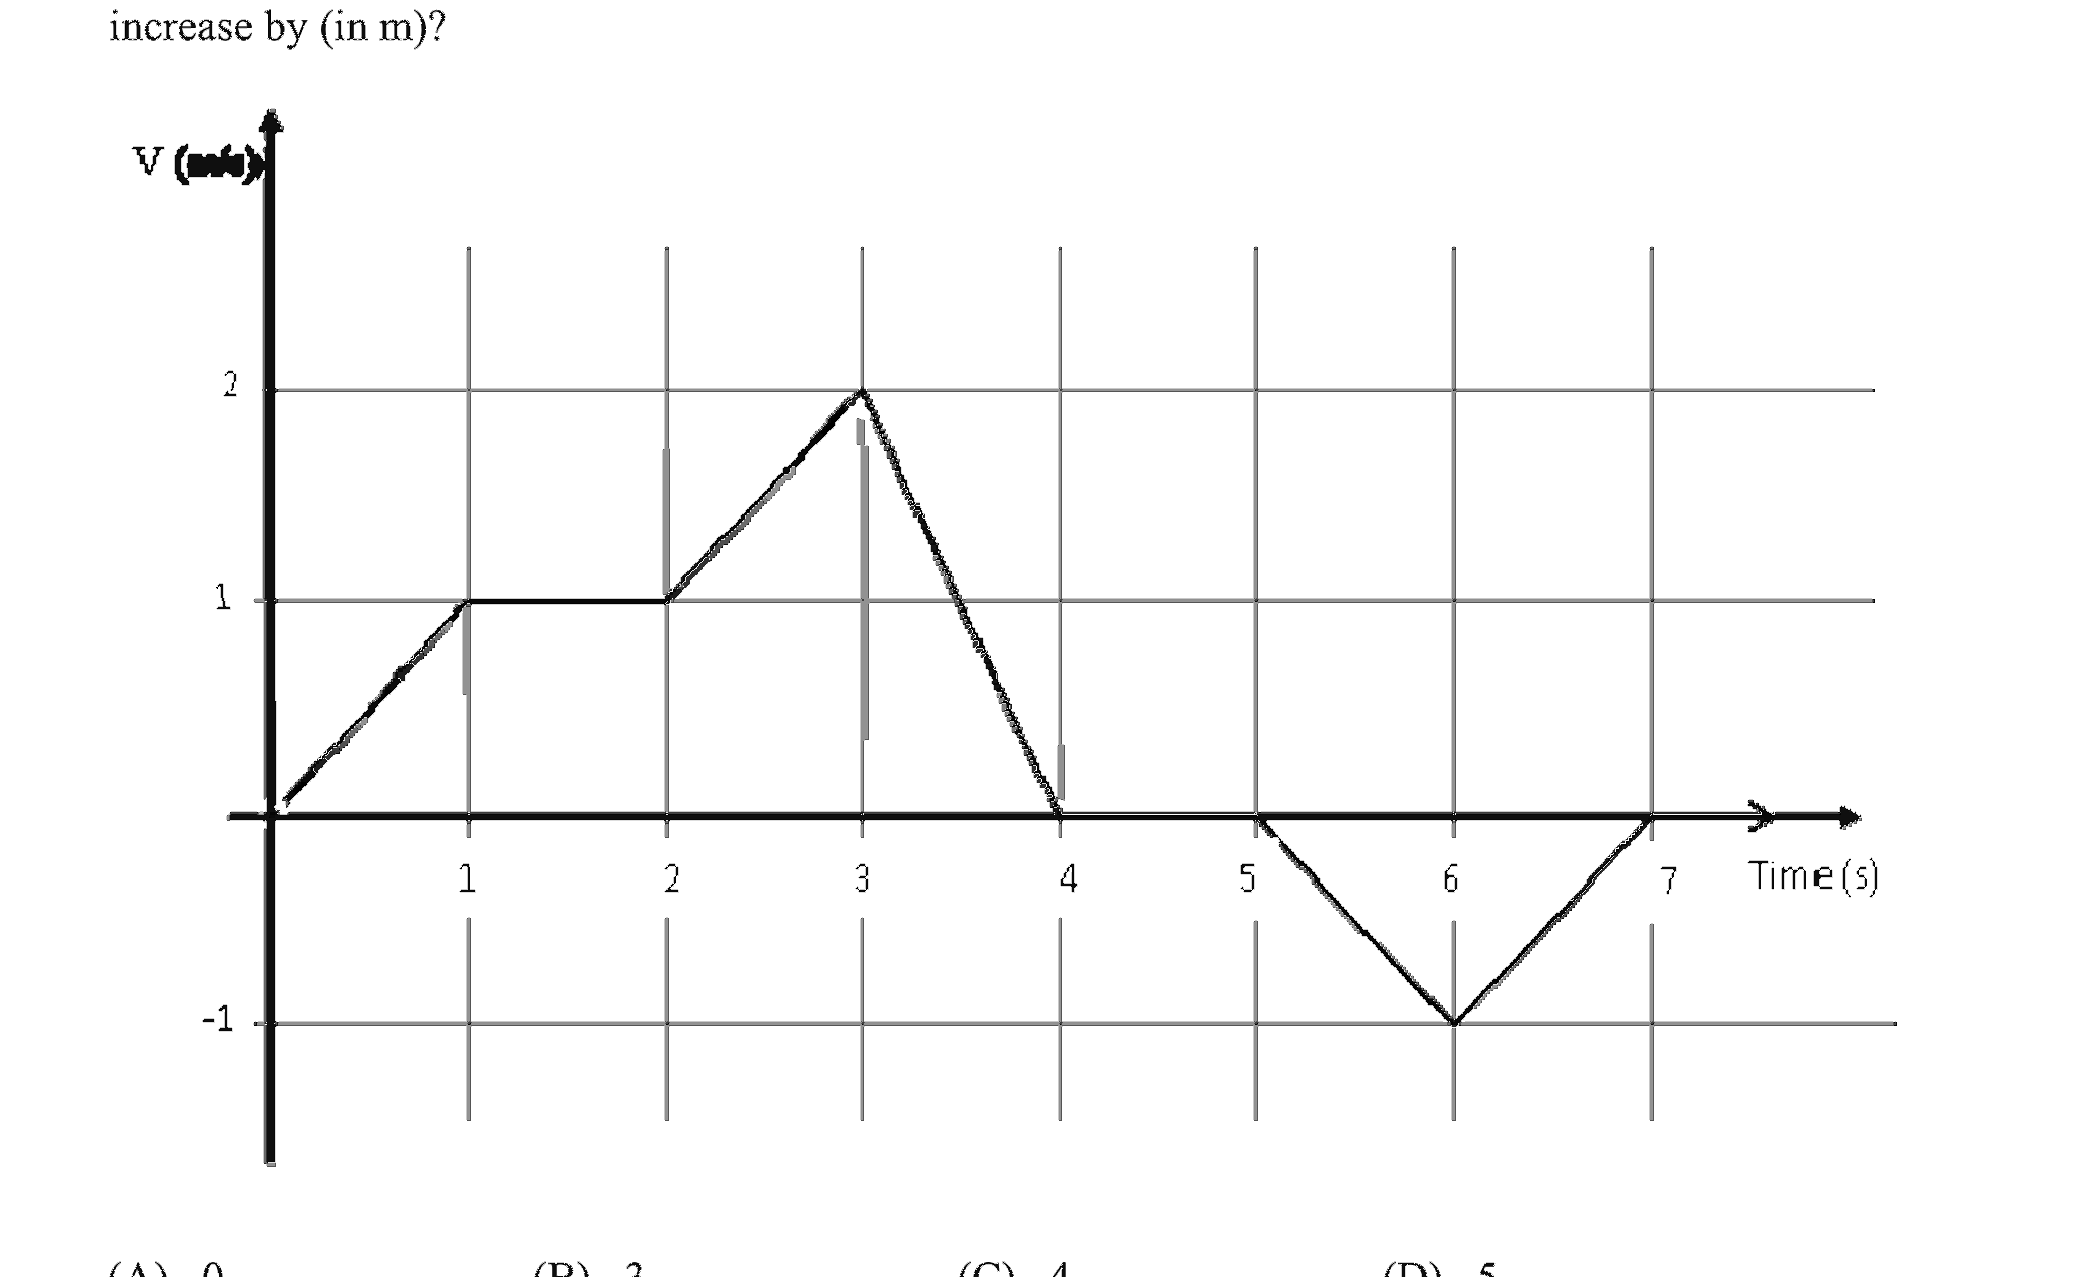
The velocity V of a vehicle along a straight line is measured in m/s and plotted as shown with respect to time in seconds. At the end of the 7 seconds, how much will the odometer reading increase by (in m)?
Open complete paper
2
2016 · General Aptitude (GA) · General Aptitude · Data Interpretation
Chemistry (CY) 2016
A straight line is fit to a data set (ln x, y). This line intercepts the abscissa at ln x = 0.1 and has a slope of −0.02. What is the value of y at x = 5 from the fit?
Open complete paper
3
2024 · General Aptitude (GA) · General Aptitude · Data Interpretation
Chemistry (CY) 2024
In an election, the share of valid votes received by the four candidates A, B, C, and D is represented by the pie chart shown. The total number of votes cast in the election were 1,15,000, out of which 5,000 were invalid.

Based on the data provided, the total number of valid votes received by the candidates B and C is
Open complete paper
4
2025 · General Aptitude (GA) · General Aptitude · Data Interpretation
Chemistry (CY) 2025
A 4 × 4 digital image has pixel intensities (U) as shown in the figure. The number of pixels with U ≤ 4 is:

Question diagram

Open complete paper
5
2017 · General Aptitude (GA) · General Aptitude · Data Interpretation
Chemistry (CY) 2017
A contour line joins locations having the same height above the mean sea level. The following is a contour plot of a geographical region. Contour lines are shown at 25 m intervals in this plot.
The path from P to Q is best described by
Open complete paper