Difficulty distribution
How the classified questions are distributed by difficulty.
Your cart is empty.
Practice Data Interpretation - General Aptitude - General Aptitude (GA) previous year questions organised from real papers, with year-wise coverage and clear topic navigation.
Every graph below is calculated only from this selection.
Year-wise coverage for Data Interpretation. Each bar uses a separate theme-derived color.
How the classified questions are distributed by difficulty.
MCQ, numerical, multiple-select and other formats found in these papers.
Top subjects by unique question coverage.
Top topics across the included previous year papers.
Top subtopics inside this exact selection.
Question coverage for the most populated papers. Every active PYP paper remains listed below.
Newest papers appear first. Sort by year, question coverage or name.
| Paper | Year / session | Questions in this view | Open |
|---|---|---|---|
| Agricultural Engineering (AG) 2024 | 2024 | 1 | View paper |
| Agricultural Engineering (AG) 2020 | 2020 | 1 | View paper |
| Agricultural Engineering (AG) 2019 | 2019 | 2 | View paper |
| Agricultural Engineering (AG) 2018 | 2018 | 1 | View paper |
| Agricultural Engineering (AG) 2017 | 2017 | 1 | View paper |
| Agricultural Engineering (AG) 2016 | 2016 | 1 | View paper |
| Agricultural Engineering (AG) 2015 | 2015 | 7 | View paper |
| Agricultural Engineering (AG) 2014 | 2014 | 1 | View paper |
| Agricultural Engineering (AG) 2012 | 2012 | 5 | View paper |
Practice every matching question in batches of 20, with every available option.
The soil erodibility factor needs to be determined for use in the universal soil loss equation. The length, in m and slope, in % of the experimental plot to be used for this purpose, respectively are

If x be the highest mean monthly precipitation and y be the mean annual precipitation, then the 'rainfall aggressiveness' to soil erosion is
The USDA classification of irrigation water with regard to alkali and salinity hazards is based on
An unsteady time-drawdown pumping test was conducted in a confined aquifer and the drawdown was measured with time in an observation well located at a certain distance away from the pumping well. Using these time-drawdown data, we can determine


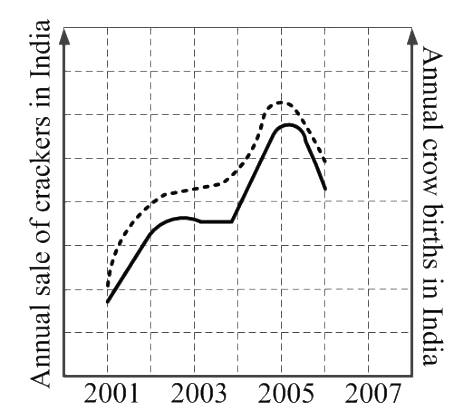
In a detailed study of annual crow births in India, it was found that there was relatively no growth during the period 2002 to 2004 and a sudden spike from 2004 to 2005. In another unrelated study, it was found that the revenue from cracker sales in India which remained fairly flat from 2002 to 2004, saw a sudden spike in 2005 before declining again in 2006. The solid line in the graph below refers to annual sale of crackers and the dashed line refers to the annual crow births in India. Choose the most appropriate inference from the above data.

| Column-I | Column-II |
|---|---|
| 1) Uniformly spaced contour lines | P) Flat ground |
| 2) Widely spaced contour lines | Q) Steep ground |
| 3) Closely spaced contour lines | R) Hill |
| 4) A series of close contours with high value inside | S) Uniform slope |

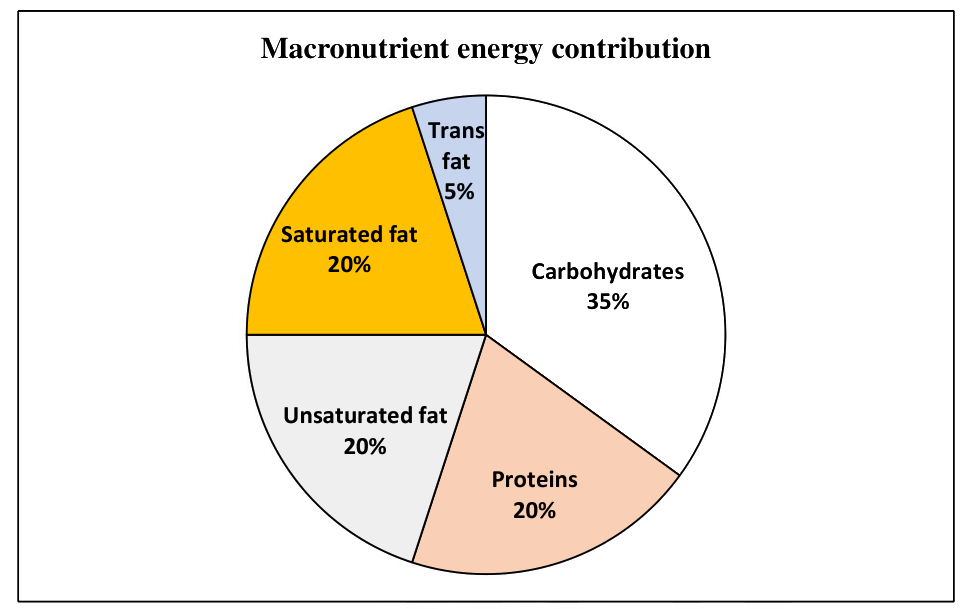
| Macronutrient | Energy density (kcal/g) |
|---|---|
| Carbohydrates | 4 |
| Proteins | 4 |
| Unsaturated fat | 9 |
| Saturated fat | 9 |
| Trans fat | 9 |