Q11Multiple choice
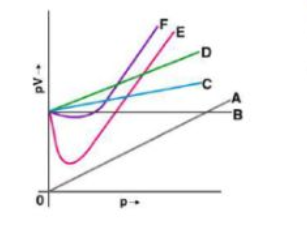
Which curve in Fig. 5.2 represents the curve of an ideal gas?
Show answerHide answer
Correct option: A
Show solutionHide solution
Worked solution
Option (i) is the answer.
Your cart is empty.
Practice each question, then open the answer or worked solution.
Which curve in Fig. 5.2 represents the curve of an ideal gas?
Option (i) is the answer.
Increase in kinetic energy can overcome intermolecular forces of attraction. How will
the viscosity of liquid be affected by the increase in temperature?
Option (iii) is the answer.
How does the surface tension of a liquid vary with an increase in temperature?
Option (ii) is the answer.