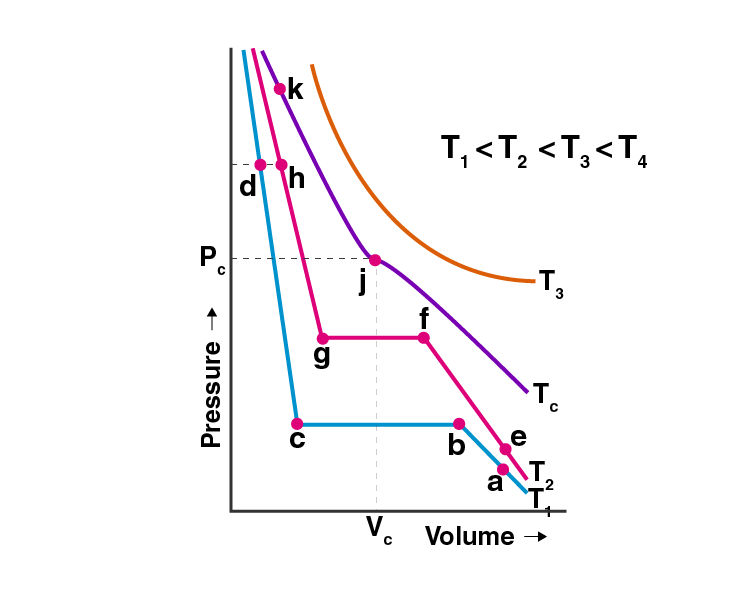
(i) CO2 exists as in the gaseous state between the points ‘a’ and ‘b ’at temperature T1 because from point ‘a’ to ‘b’ volume starts decreasing and the pressure increases and the gaseous molecules start to come closer but exist in the gaseous state only.
(ii) At the temperature, T1 CO2 starts liquefying at the point ‘b’. Because at point ‘b’ the liquefication has just started or commences.
(iii) At the temperature T2, CO2 will be completely liquefied at the point ‘g’. Because in the curve at the temperature T2 point ‘f’ to ‘g’ represents the phase where the gas is being converted to liquid and at point ‘g’ all the gas has been converted to liquid.
(iv)As stated in the graph T3 > TC > T2 > T1. Temperature T3 > TC i.e. the critical temperature so condensation will not take place when the temperature is T3. Because critical temperature is the temperature of gas above which gas cannot be liquified howsoever high pressure is applied and T3 is greater than TC.
(v)At the temperature T1 curve the equilibrium of liquid and gaseous state of CO2 is represented between the point’s ‘b’ and ‘c’. Because between the points ‘b’ and ‘c’, the pressure being the constant volume of a gas decreases till point ‘c’ so between these points CO2 gas partially exists as in liquid and the gaseous state i.e. existing in equilibrium.